You Choose: Potentially Get Paid to Wait or Get Punched in the Face
September 15, 2023
What makes MKAM ETF distinct is the proprietary algorithm it employs to obtain, we believe, a better measure of risk and return than the average market participant. We subscribe to the general advice that you want to be invested in stocks most of the time. However, historically, about 15% of the time, the stock market is both expensive and characterized by bad momentum. Avoiding this “red zone” allowed investors to generate most or all of S&P 500[1] returns, historically, while eliminating substantial drawdowns, defined as those significantly worse than-10%.
Since our ETF’s launch in April the market, and our algorithm, hasn’t changed much. Stocks remain too expensive and yet continue to rise. Consequently, we began our life as a public ETF with 50% exposure to the S&P 500 through low-cost ETF IVV. That exposure grew to 52% at the end of August, as the stock market, and MKAM, increased in value. But otherwise, the stock market has been boringly consistent. In stark contrast, all the action is in the bond market.
Fortunately, we can apply the same principles of our algorithm to the bond market. Our valuation discipline continues to favor short-term or low-duration[2] bonds. Our trend indicators continue to tell us to wait before we begin to add longer-term bonds to the portfolio, extending our duration.
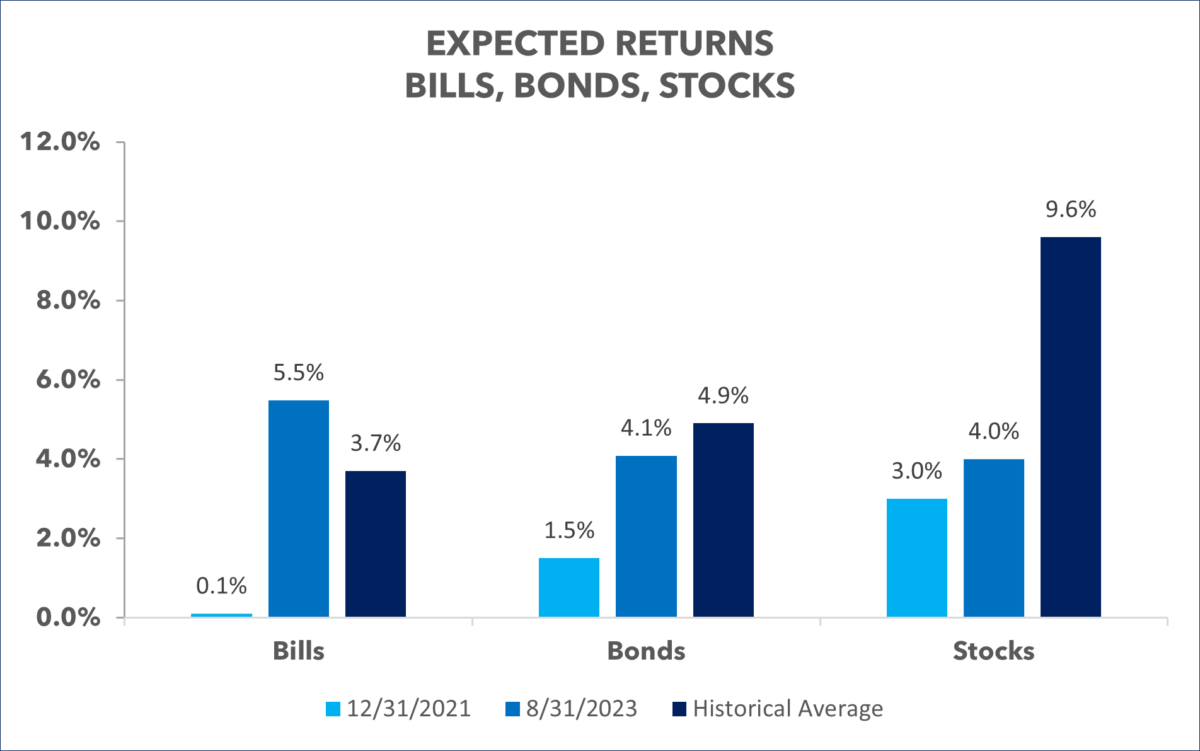
At the end of 2021, just before the Federal Reserve finally began the first material and sustained rate hiking cycle since the Great Financial Crisis of 2008, 3-month US Treasury Bills yielded a paltry 0.1%. This prompted Bridgewater founder Ray Dalio to pronounce “cash is trash.”

In less than two years, 3-month US Treasury yields rose considerably. As we write, they pay 5.5%. Especially for being the closest instrument to risk free in the market, 5.5% is a great return. Further, it is substantially above its historical average. Cash is, once again, king.
From real estate to the stock market, most assets today are still priced for the zero-interest rate world of 2009 through 2021. They offer substantially lower than normal returns. The lone exception is 3-month US Treasury bills. And MKAM ETF is flush with them.
10-Year US Treasuries are approaching their long-term average of 4.9%. They ended August at a yield of 4.1% and further spiked after the September 1st strong jobs report to 4.3%. Today, they sit only 60 basis points[3] below their long-term average.
While those rates are approaching normal levels, they’re still abnormal in that the yield curve is inverted: short-term rates are above long-term rates. This defies the very concept of the time value of money.

To quote the Federal Reserve[4]: “an inverted yield curve (short rates above long rates) indicates a recession in about a year, and yield curve inversions have preceded each of the last eight recessions (as defined by the NBER[5]). One of the recessions predicted by the yield curve was the most recent one: The yield curve inverted in May 2019, almost a year before the most recent recession started in March 2020.”
There have been two notable false recession forecasts from inverted yield curves in the past: 1966 and 1998.[5] The hope of the Federal Reserve today is to add a third false positive to the list. The goal of Federal Reserve Chair Jay Powell is to engineer a “soft landing,” whereby the economy cools enough to bring inflation under control but avoid causing the economy to enter a recession.
Current market consensus implies that the Fed will be successful. In this scenario, short-term interest rates would soon fall. The current Fed “dot plot” forecasts a Federal Funds rate of 2.5% to 2.75% as inflation falls to the Fed’s 2% target. If this is accomplished, using the historical positive spread to 10-year yields, the current 4.1% 10-year yield makes total sense.
There is a cogent argument, however, to be made that short-term rates will remain higher than the market expects and thus, long-term rates will continue to surprise to the upside. After 15 years we have been conditioned to believe interest rates should be lower than they were historically. But they were only brought so low to rescue the economy after the Great Financial Crisis. Further, post Covid, again a time of extreme fear, the 10-year yield hit its lowest level of 0.54%. Absent a once a hundred-year financial crisis and a once a hundred-year pandemic, why should we expect rates to be so low?
A Fed Funds Rate of 3.5% and a 10-year US Treasury yield of 5% and a 30-year mortgage rate of 6% would all be exactly in line with historical averages. And, from a fundamental level, they all make sense with a healthy economy.
Whether the Fed and current market consensus is correct, or contrarian points of view as typified by “bond king” Bill Gross and Calculated Risk author Bill McBride prove correct, the good news is we can rely on the other half of our algorithm: trend.
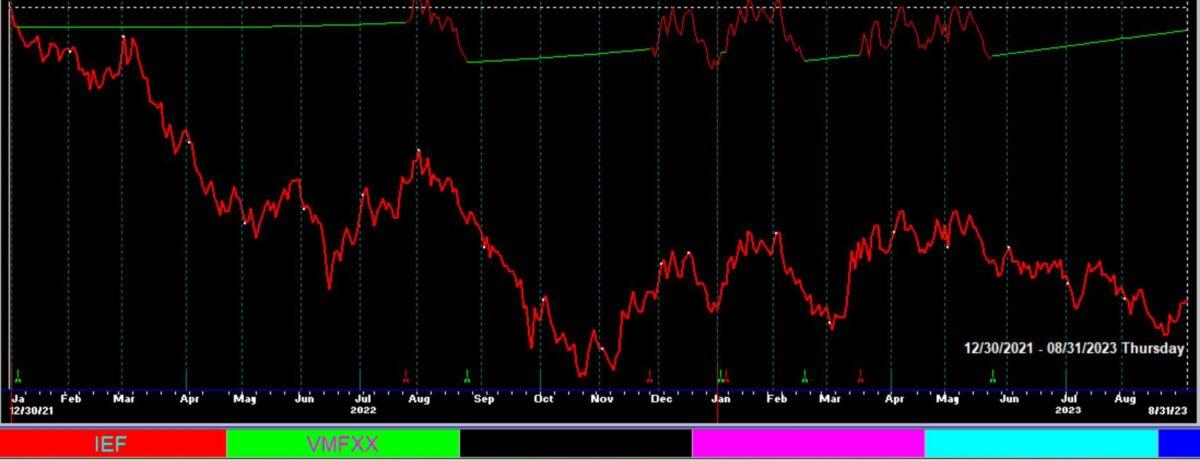
Since the end of 2021, ETF IEF, consisting of 7-to-10-year US Treasuries, is down -15%. With current US Treasury yields, IEF owners from the end of 2021 will have to wait 4 years before they recover and break even. In year 5 they would finally start to earn some net income.
On the other hand, a simple trend following strategy, similar, but shorter, than we use for the equity portion of our algorithm, would be down -1.25%, over the same time frame. This investor, given current yields, will be back in the black in a few months.

As yields continue their rising trend, and long duration bonds continue to fall, our trend indicator remains negative. In finance there is an adage to avoid “catching a falling knife.” Investors that have been jumping in to try and capture rising yields in long bonds have been doing exactly that and it has been very painful!
When bond trends turn positive our investors can expect that we will begin to extend our duration. Investing when returns are promising, and risk is low is a rewarding endeavor. The short-term bond market easily clears the hurdle. To find out when the long bond market does as well, stay tuned.
[1]Standard and Poor’s 500 (S&P 500) is an index of the 500 largest U.S. public companies. It measures companies’ size by their market capitalization.
[2]Duration is a measure of the sensitivity of the price (the value of principal) of a fixed-income investment to a change in interest rates. It is expressed as a number of years. Rising interest rates mean falling bond prices, while declining interest rates mean rising bond prices.
[3]Basis Point is a unit of measure used in quoting yields, changes in yields or differences between yields. One basis point is equal to 0.01%, or one one-hundredth of a percent of yield and 100 basis points equals 1%.
[4]“Yield Curve and Predicted GDP Growth,” Federal Reserve Bank of Cleveland, 2023
[5] National Bureau of Economic Research
[6] A recession did eventually occur between March and November 2001.
Keep Me Informed
Please enter your email address to be notified of new content, including market commentary and special updates.
Thank you for your interest in the MKAM Funds.
100% Spam-free. No list sharing. No solicitations. Opt-out anytime with one click.
